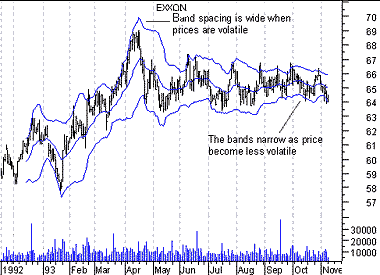
博灵哲儿频带在技术分析的领域里是一种重要的包络曲线标。博灵哲儿频带也是由三条曲线所组成。博灵哲儿频带的上移曲线和下移曲线的波动是根据股价的趋势和移动平均线而形成。
博灵哲儿频带的原理是显示股价的高点与低点相对移动,而不是显示买卖的讯号。
博灵哲儿频带的应用:
-
当股价波动变缓慢时,博灵哲儿频带的包络曲线将会缩窄,股价趋势将会有反转的讯号。
-
当股价接近博灵哲儿频带的上移曲线或下移曲线时,投资人士理应取用其他技术指标去推测股价的走势。如果上升股价接近博灵哲儿频带的上移曲线时,如技术指标显示向上移动讯号,推测股价是会向上扳升。相反,下降股价接近博灵哲儿频带的下移曲线时,如技术指标显示向下移动讯号,推测股价是会向下跌落。
-
当股价急速上升突破博灵哲儿频带的上移曲线,博灵哲儿频带会产生拉力效应将股价拉回包络曲线里面。
-
当股价急速下跌突破博灵哲儿频带的下移曲线,博灵哲儿频带会产生拉力效应将股价拉回包络曲线里面。
|
|

bollinger Bands are displayed as three
bands. The middle band is a normal moving average. In the
following formula, "n" is the number of time periods in the
moving average (e.g., 20 days).

The upper band is the same as the middle
band, but it is shifted up by the number of standard
deviations (e.g., two deviations). In this next formula, "D"
is the number of standard deviations.

The lower band is the moving average
shifted down by the same number of standard deviations
(i.e., "D").

Mr. bollinger recommends using "20" for
the number of periods in the moving average, calculating the
moving average using the "simple" method (as shown in the
formula for the middle band), and using 2 standard
deviations. He has also found that moving averages of less
then 10 periods do not work very well.
|