A simple moving average is formed by finding the average
price of a security over a set number of periods. Most often,
the closing price is used to compute the moving average. For
example: a 5-day moving average would be calculated by adding
the closing prices for the last 5 days and dividing the total by
5.

A moving average moves because as the newest period
is added, the oldest period is dropped. If the next closing
price in the average is 15, then this new period would be added
and the oldest day, which is 10, would be dropped. The new 5-day
moving average would be calculated as follows:

Over the last 2 days, the moving average moved from 12 to 13.
As new days are added, the old days will be subtracted and the
moving average will continue to move over time.

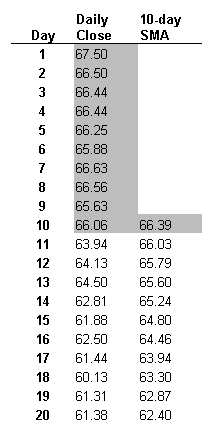
In the example above, using closing prices from Eastman Kodak
(EK), day 10 is the first day possible to calculate a 10-day
moving average. As the calculation continues, the newest day is
added and the oldest day is subtracted. The 10-day moving
average for day 11 is calculated by adding the prices of day 2
through day 11 and dividing by 10. The averaging process then
moves on to the next day where the 10-day moving average for day
12 is calculated by adding the prices of day 3 through day 12
and dividing by 10.

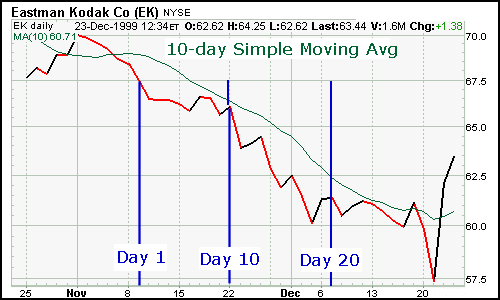
The chart above is a plot that contains the data sequence in
the table. The moving average begins on day 10 and continues.
This simple illustration highlights the fact that moving
averages are lagging indicators and will always be behind the
price. The price of EK is trending down, but the moving average,
which is based on the previous 10 days of data, remains above
the price. If the price were rising, the moving average most
likely be below. Because moving averages are lagging indicators,
they fit in the category of trend following. When prices are
trending, moving averages work well. However, when prices are
not trending, moving averages do not work.